PROJECT
kNN Classification for Breast Cancer Diagnosis
Built a custom k-nearest neighbors classifier to distinguish malignant and benign breast cancer samples using normalized diagnostic features.
Project Overview
This project applies a k-nearest neighbors classification workflow to the Wisconsin Diagnostic Breast Cancer dataset. The analysis focuses on building the model from the ground up, selecting an optimal k value, and evaluating performance using cross-validation, ROC/AUC, and final test-set metrics.
Key Results
95.6%
Final test accuracy using the selected k value.
0.979
AUC score on the test set, showing strong class separation.
k = 3
Optimal k selected using repeated 10-fold cross-validation.
Leak-Free Scaling
Z-score normalization was fit only on training data and applied to test data.
Basic Workflow Diagram
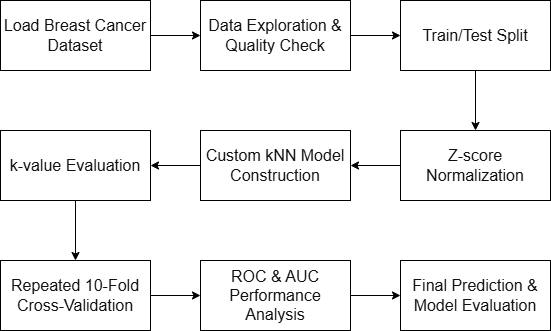
What I Built
- Implemented core kNN helper functions for distance calculation, neighbor selection, label prediction, and batch prediction.
- Used z-score normalization based only on the training set to avoid data leakage.
- Evaluated odd k values from 1 to 51 and confirmed model choice using repeated 10-fold cross-validation.
- Calculated ROC curve and AUC to measure model discrimination beyond accuracy alone.
- Reported final confusion-matrix metrics including true positives, true negatives, false positives, and false negatives.
Visualization
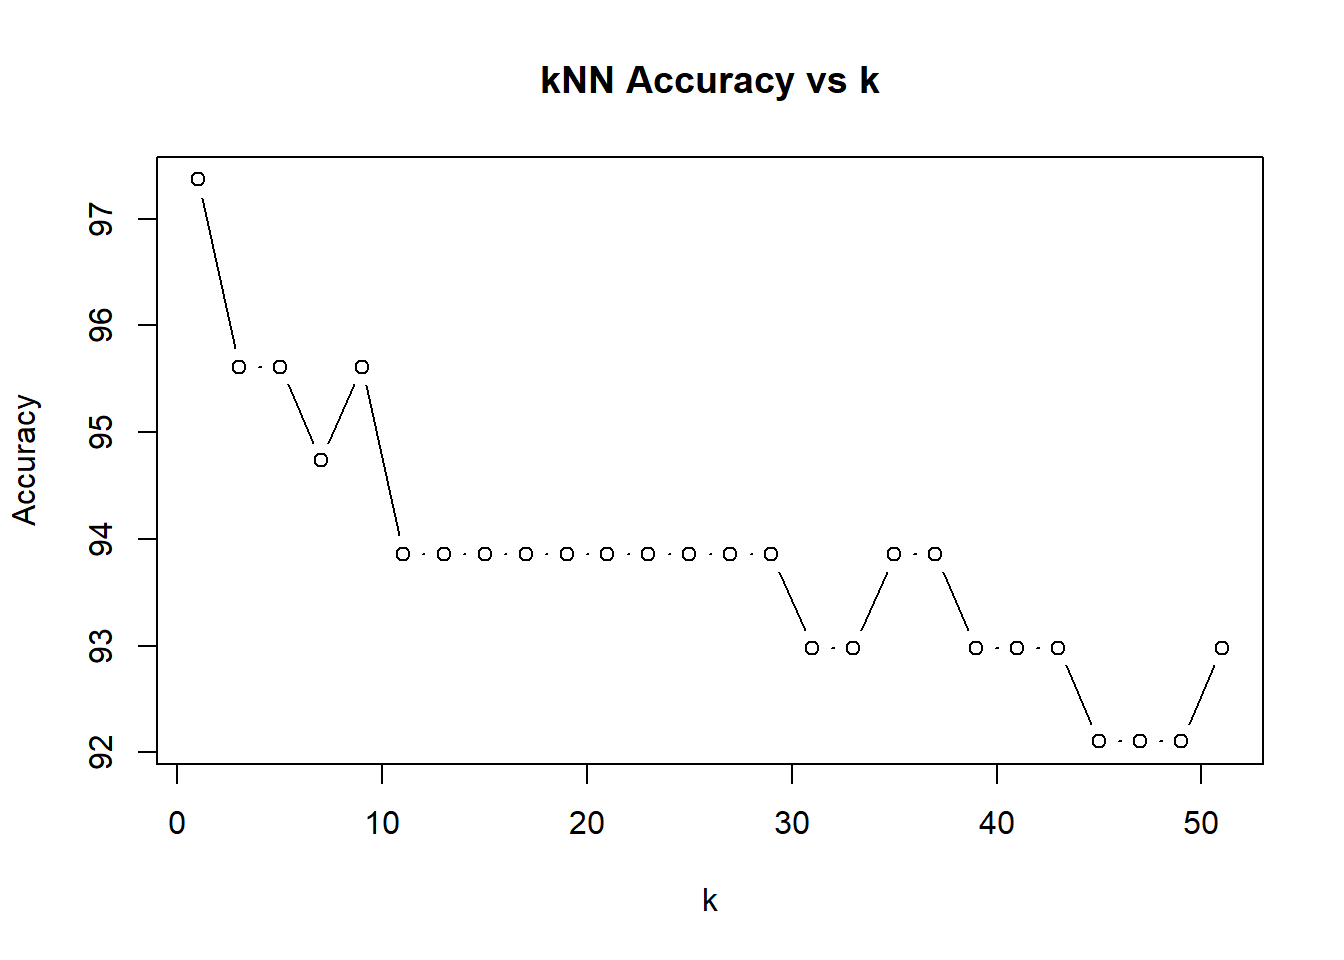
Accuracy vs. k
Compared model performance across odd k values from 1 to 51.
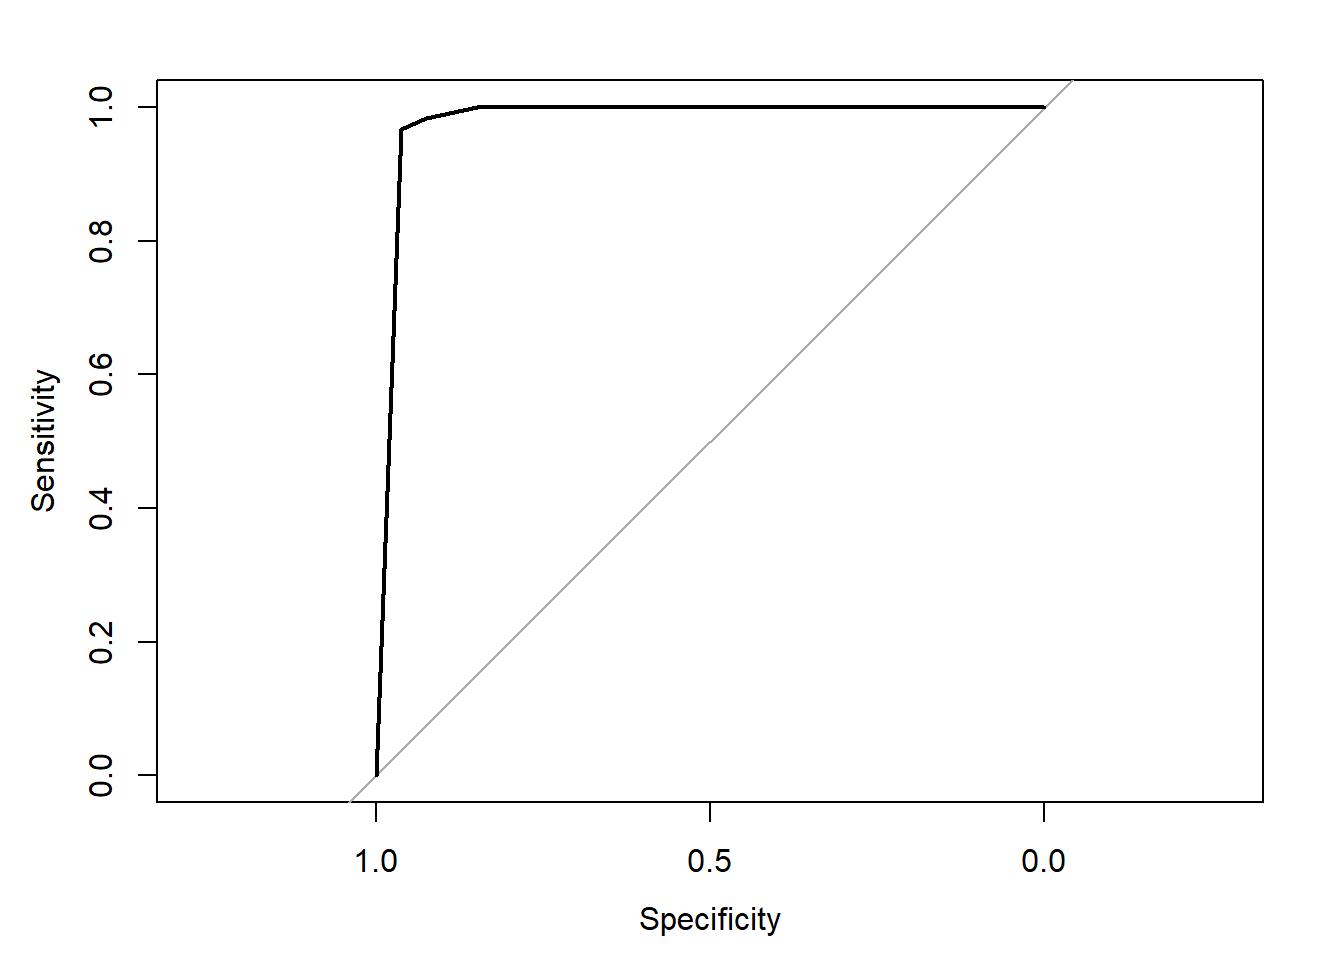
ROC Curve
Evaluated classification performance using probability-like malignant-neighbor scores.
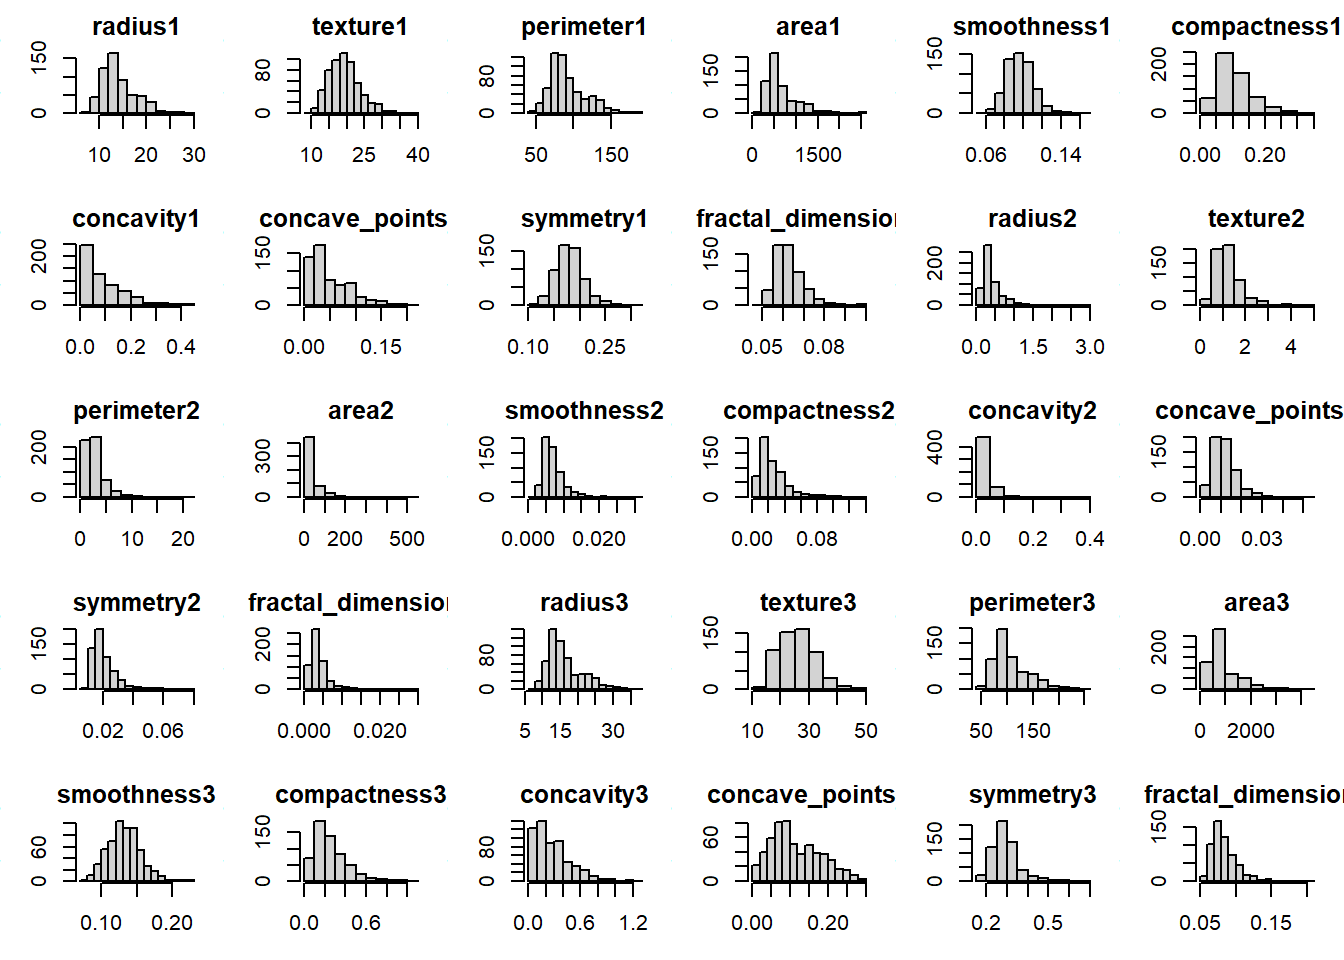
Feature Distributions
Reviewed numeric feature distributions before model training.
Final Prediction Summary
| Predicted Malignant | Predicted Benign | |
|---|---|---|
| Actual Malignant | 49 | 4 |
| Actual Benign | 1 | 60 |
Modeling Details
Distance Metric
Euclidean distance was used to measure similarity between normalized samples.
Target Classes
Diagnosis was modeled as a two-class outcome: malignant and benign.
Model Selection
Repeated 10-fold cross-validation was used to select a more reliable k value.
Evaluation
Performance was evaluated using accuracy, confusion-matrix counts, ROC curve, and AUC.
Interpretation
The final model achieved strong classification performance, with high accuracy and an AUC close to 1. The cross-validation results selected k = 3, which provided a more reliable choice than simply using the highest test-set accuracy from a single split. This project demonstrates the full machine learning workflow from preprocessing and model construction to validation and performance interpretation.